Sub-setting Qualitative Data for Machine Learning or Export

By Corey M. Abramson
Corey M. Abramson provides hands-on exercises and more insights for using sets in qualitative research during the Computer-Assisted Qualitative Data Analysis short course.
Many researchers use ‘sets’ in analyzing qualitative data, such as in-depth interview transcripts, fieldnotes, and focus groups.
Sets are groups of ‘things,’ grouped in ways designated by a researcher or team. In qualitative and mixed-methods research, sets often involve documents with text representations of what people say and/or do. We can use sets to organize our work for analysis, to understand patterns, and to engage in comparison.
For instance, I’ve analyzed:
- Sets of interview transcripts organized by the neighborhood in which respondents lived.
- Sets of field notes organized by location type (e.g., bars, hospitals, housing).
- Sets of memos on illness trajectories categorized by type of cancer.
- Sets of focus groups organized by which stakeholders were involved (e.g., providers, patients).
- Sets of open-ended responses to surveys organized by demographics (e.g., age groups).
- Sets of text that share a code or theme (e.g., examples of #mobility_problems in centers).
Creating sets requires that analysts have some idea about boundaries. Deciding which information is data for a study is a core act of ‘setting’ necessary to creating a dataset. Breaking the result down into smaller chunks for analysis can be thought of as ‘sub-setting.’
Creating sets does not require or imply that you know all of the nuances or analytical categories that will be important at the end of a study or analysis. Moving from preliminary to more precise sets, explaining “what your data are a case of,” and deciding which boundaries matter for the research at hand, are part of the iterative qualitative research process.
Sometimes, criteria for sets ‘emerge’ during analysis. For instance, although I did not sample on region of birth in my book The End Game, I organized interview transcripts by whether people grew up in the South during segregation. That distinction turned out to be important in explaining how people navigated health and illness, and the role of prior experiences with race and medicine.
Other times, my sets reflect an explicit sampling strategy. In the same study, I knew I would interview people from different neighborhoods and compared responses in those sets. Sets are not mutually exclusive (unless you want them to be)— so an interview could be in both the set born_in_south and neighborhood_rockport. In qualitative analysis, we can use either, neither, or both sets as we search through, analyze, and compare text.
Sometimes looking at where sets overlap is of interest, as shown in this Venn diagram by XKCD.
There are classic methods volumes and a robust literature on the implications of sets and cases. There is much written on comparison in history and ethnography. But there is also a narrower technical aspect that affects analyzing qualitative data with computers, which I will speak to here.
Example in ATLAS.ti
Most modern qualitative data analysis programs like ATLAS.ti, MAXqda, and NVIVO allow an analysis of qualitative sets in the software interface. Still, I’ve often needed to export subsets of text in both individual and team projects for analysis in external software. Here, QDA software allows tools for parsing data representing observed human behavior and narrative–e.g., in-depth interviews, field observations, and focus groups— for export.
Sub-setting hundreds or thousands of pages of text generated in a study is particularly important for procedures and comparative analyses that involve computation.
For instance:
- Using machine learning to scale interpretive human coding of qualitative interviews.
- Generating visualizations of patterns in data software science packages.
- Conducting computational social science analyses of text like topic modeling.
My belief is interpretive analyses and computation can be fruitfully combined for some qualitative and mixed methods projects, and I use computers throughout the analysis process, so my examples are structured to reflect this.
Practically, I use computer assisted qualitative data analysis software, such as ATLAS.ti, to code data, analyze patterns, and call up quotations while writing. I also use the software to provide a simple interface for sub-setting as well.
Below, I demonstrate how text can be sub-set and exported for external analyses. For those familiar with R or Python, the goal in this example is to use ATLAS.ti to export text into a machine readable data frame alongside meta-data (e.g., which codes were applied to the text). On a more basic level, this can be thought of as just putting information you want to analyze outside the QDA software into a spreadsheet.
NOTE: I use ATLAS.ti windows version 23, since this is the latest and most full-featured edition at the time of writing. The data are from the public American Presidency Project and are organized for machine learning, but this process will work with a more standard qualitative approach.
Instructions
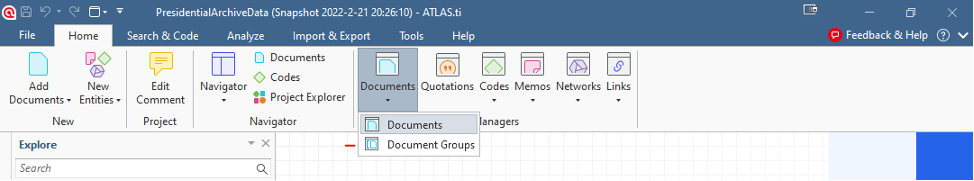
First, if you want to limit your set to include only certain documents–for instance interviews with a particular president–click on “open document group manager.”
Figure 1 (below)
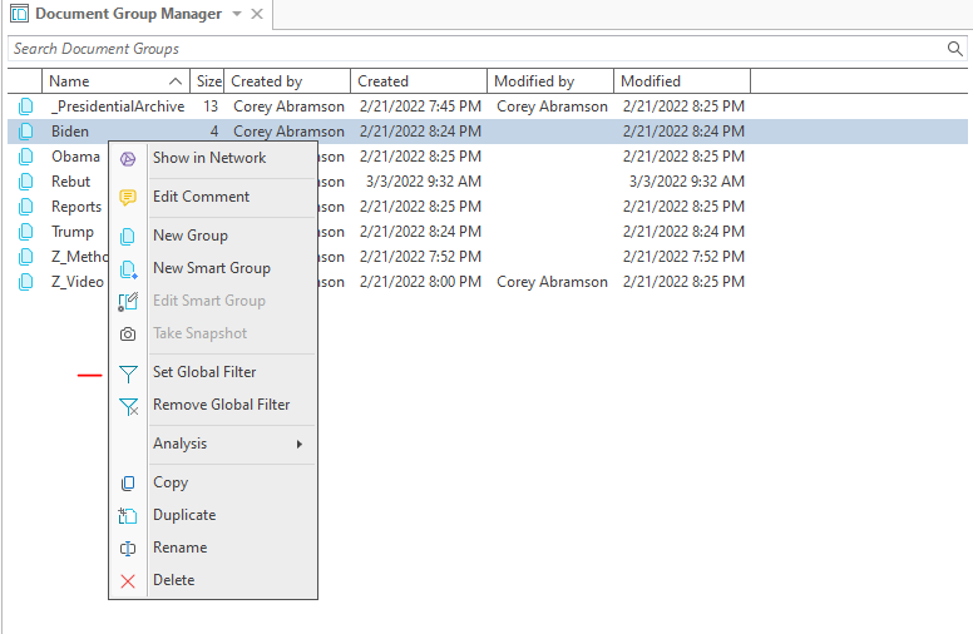
In that window, right click on the document group you wish to use (the group is like a virtual folder containing documents that share a similar characteristic), right click on the group icon, and select “set global filter” from the pop-up menu. You can use “remove global filter” to undo.
- This process tells ATLAS.ti to only show and output data from the selected set.
- Alternatively, you can apply the filter from the document manager directly (by right clicking the group icon).
- The advantage of the document group manager is it is easy to quickly check and adjust set membership. The advantage of the document manager is the ability to use multiple document groups by ctrl-clicking.
Figure 2 (below)
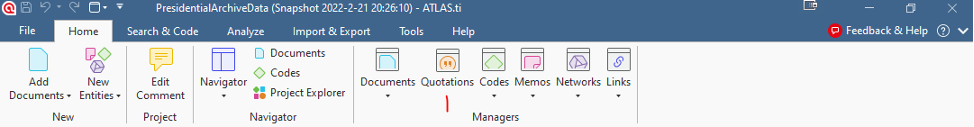
Next, open the quotation manager.
Figure 3 (below)
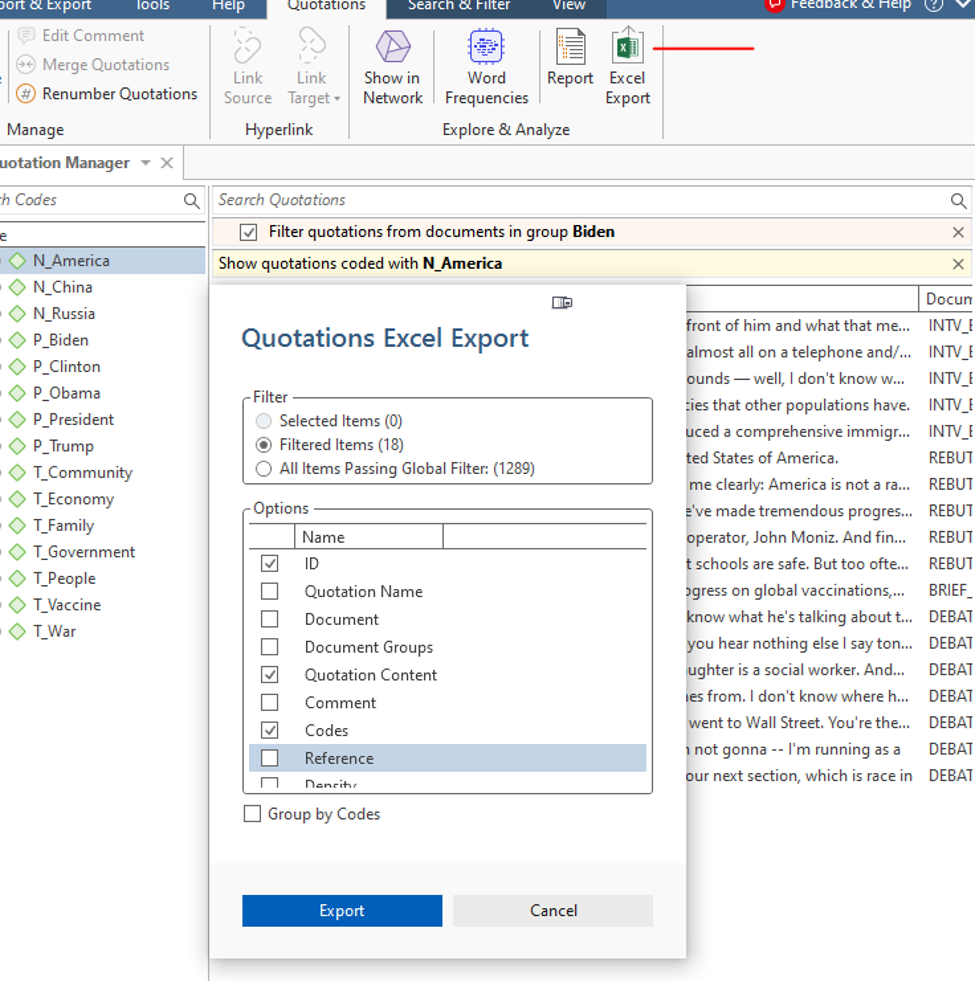
If you would like to select a code or codes to limit the quotations that appear to paragraphs that are indexed by it, left click the code. This limits the set to the corresponding concept/category/variable/theme/# tag your code represents.
Figure 4 (below)
Finally, click the Excel Export button at the upper right (seen in figure 5 below). You will get a pop-up asking which information you want to include.
Select filtered items.
- “Quotation content” is the actual text and should be checked.
- “Codes” adds codes and should be checked.
- I’ve clicked those I typically use.
- ID, document, and reference provides information on quotation position in the ATLAS.ti data set, which become important for linking the data in machine learning.
TIP: You can click everything to explore the data or sort in Excel, then delete columns that are not necessary.
Figure 5 (below)
After you click export, you will get a spreadsheet in the format below. This can be saved as an .xlxs file or .csv in Excel.
Figure 6 (below)
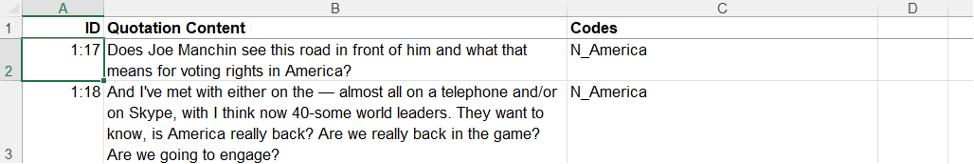
Once the text is output in this tabular form, it can be imported into a program like R or Python. It works as a data frame for the hybrid coding approach combining human interpretation and machine learning (HHMLA) described here (links to the Python code are provided in the paper), as well as many other external options for analysis and visualization.
Looking for more useful tools to organize and make the most of your qualitative data? Read Corey M. Abramson’s blog post on Qualitative Coding Simplified.
Leave a Reply
Want to join the discussion?Feel free to contribute!